

Skip to content
SFO

Kaplan & Norton Balanced Scorecard methodology

Measure how well your strategy actually gets executed

A standardised diagnostic across five execution principles, scored 1–5 on 30 items, aggregated from subsidiary to region to global enterprise, and benchmarked against published regional and sector baselines.

30
diagnostic items
5
execution pillars
5
maturity levels
6
regional benchmarks

Five principles of a Strategy-Focused Organization

Successful execution depends on aligning the whole organization around these five management principles.

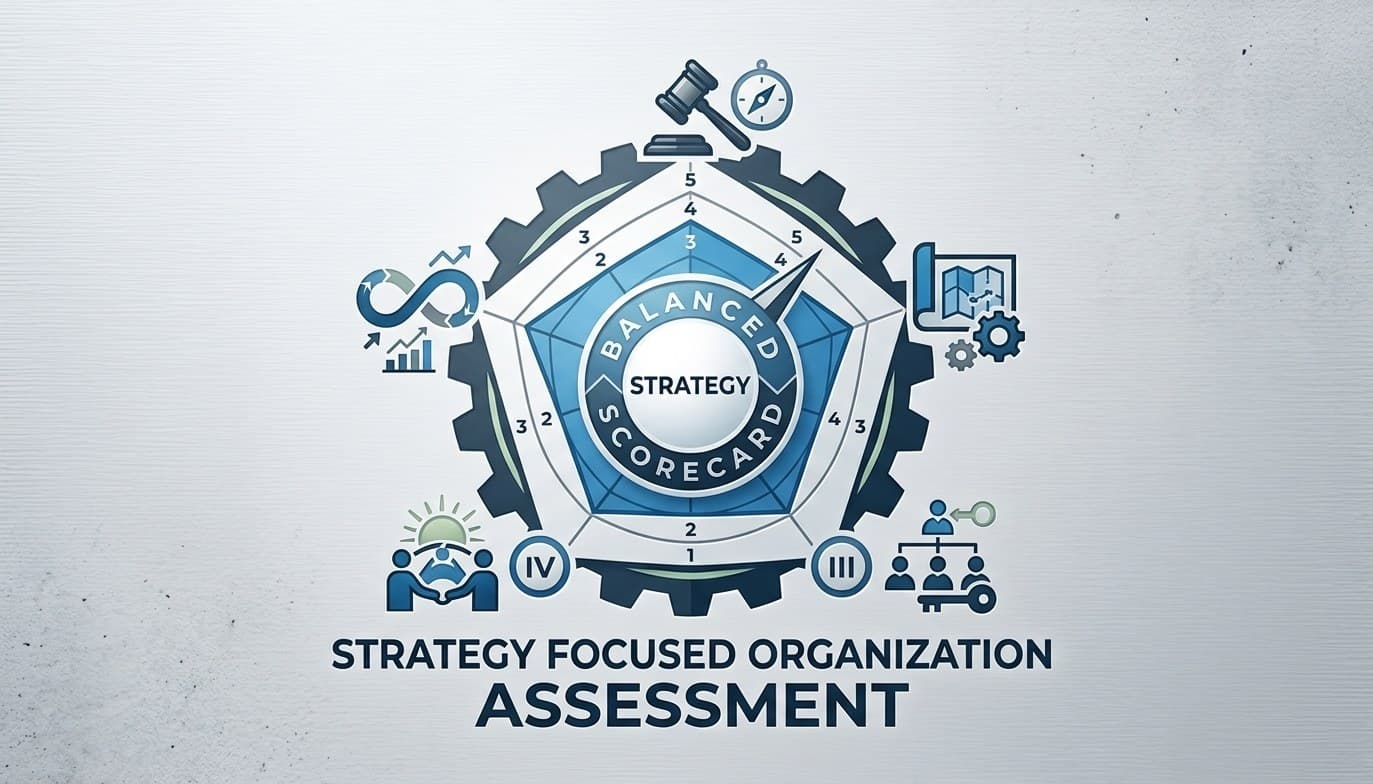
The Strategy-Focused Organization framework: a balanced scorecard at the centre of a five-sided model, with each side scored 1 to 5.
The five principles form one closed system — each is scored 1–5 and the five together give the SFO Index.
  1. Leadership Mobilization

    Mobilize Change Through Executive Leadership

    The executive team owns, sponsors and communicates the strategy, creates the case for change, and reallocates resources behind strategic priorities.

  2. Strategy Translation

    Translate Strategy into Operational Terms

    Strategy Maps and Balanced Scorecards convert intent into cause-and-effect objectives, balanced measures, stretch targets and a funded initiative portfolio.

  3. Organizational Alignment

    Align the Organization to the Strategy

    Corporate strategy cascades to business units, regions and shared services, with cross-functional themes and board-level oversight.

  4. Individual Alignment

    Make Strategy Everyone's Everyday Job

    Communication, personal goals, incentives, competency development and culture connect every employee to the scorecard.

  5. Continual Governance

    Make Strategy a Continual Process

    Budgeting, monthly strategy reviews, hypothesis testing, rolling forecasts and performance systems keep strategy live between planning cycles.

From item score to enterprise index

Every item is answered on a 1–5 maturity scale. Item scores roll up to a pillar percentage, pillars roll up to the overall SFO Index at 20% each, and entity indices roll up through the hierarchy weighted 50/50 by revenue and headcount.

  1. 01

    Item

    30 items, each scored 1 (ad-hoc) to 5 (best-in-class), with an evidence note for the audit trail.

  2. 02

    Pillar

    Pillar score = sum of item scores ÷ (5 × items answered), expressed as a percentage.

  3. 03

    Entity

    SFO Index = the weighted sum of the five pillar scores at the standard 20% each.

  4. 04

    Enterprise

    Subsidiaries roll into regions and regions into the group, weighted by revenue and headcount.

Benchmarked, not just scored

Every result is positioned against published regional baselines and industry-sector peers, so a 68% means something concrete.

Benchmarked, not just scored
RegionSFOP1P2P3P4P5
North America71.2%76.4%74.1%72.0%68.5%65.0%
Europe68.8%72.0%71.5%70.2%64.1%66.2%
Asia-Pacific66.4%74.2%68.0%65.1%62.3%62.4%
Middle East & North Africa64.5%73.0%66.2%61.4%58.9%63.1%
Latin America62.1%69.5%63.0%60.5%59.2%58.3%
Sub-Saharan Africa58.7%66.1%59.4%57.0%56.1%54.9%
Global benchmark average66.1%72.4%68.2%65.6%62.2%62.0%

The leadership–execution gulf

Worldwide, organizations score highest in executive leadership mobilization (72.4%) but drop sharply in individual alignment (62.2%) and continual process (62.0%). Strategy fails during cascading and operational execution.

The budget disconnect

Over 68% of evaluated global organizations fail to separate strategic expenditure (STRATEX) from operational expenditure (OPEX), leading to short-term budget consumption of strategic funds.

Regional variations

North America is high on incentive alignment but struggles with double-loop agility. Europe is strong on risk integration and governance but slower to execute. MENA and APAC show strong top-down leadership mobilization with gaps in horizontal cross-unit alignment.

Four reports, four audiences

The same assessment data, presented for the people who need to act on it.

01

Executive Board Strategy Execution Scorecard

High-level summary of overall strategy execution readiness and maturity across the entire enterprise.

Audience: Board of Directors, CEO, Group Executive Committee

02

Regional & Business Unit Comparison Matrix

Cross-comparison across geographical regions or business units to identify performance variances.

Audience: Chief Operating Officer, Regional Presidents, Head of Strategy

03

Subsidiary / Operating Company Deep-Dive

Detailed diagnostic breakdown for a single operating company or business entity.

Audience: Subsidiary CEO, Local Managing Director, Local Strategy Team

04

Industry & External Peer Benchmark

External positioning of the firm against peer companies and global industry leaders.

Audience: Group Strategy VP, Corporate Development, Investors

A four-phase rollout

The recommended methodology for running the assessment across an enterprise.

  1. Phase 1: Prepare

    Weeks 1–2

    Define scope · Appoint the OSM team · Select entities

  2. Phase 2: Assess

    Weeks 3–5

    Launch the survey · Stakeholder interviews · Evidence audit

  3. Phase 3: Analyze

    Weeks 6–7

    Score aggregation · Benchmark mapping · Report generation

  4. Phase 4: Execute

    Weeks 8+

    Governance cadence · Action plan rollout · Annual re-index

Ready to index your execution capability?

Set up your entity hierarchy, run the diagnostic, and get board-ready reporting in the same week.

Create your account